
Almost no trusted labels
Confirmed fraud is rare, delayed and selected. Building evaluation you can defend with limited positive labels — and being honest about what the metrics mean — was harder than training the model.
Anomaly detection and decision support for tax compliance and revenue assurance.
Research and academic work, evolving into a product surface. Not a deployed commercial tax product.
01
Tax compliance and revenue assurance depend on spotting patterns that do not add up: revenue that does not reconcile with cash flow, receivables that age oddly, inventory that never turns, profit and tax that disconnect.
Analysts cannot read every filing at depth. The problem is not lack of data — listed companies publish plenty — but lack of a systematic first pass that ranks where human attention should go, with enough explanation to trust the ranking.
Labels are scarce. Confirmed fraud cases are rare, delayed and biased, so conventional supervised classification alone is a weak fit for the domain.
02
Research and academic work exploring anomaly detection on financial disclosures from Nigerian Exchange (NGX)-listed companies, with an interface prototype for analyst workflows.
Presented as research. It is not a commercial tax product, not certified for regulatory use, and not deployed with production clients.
03
04
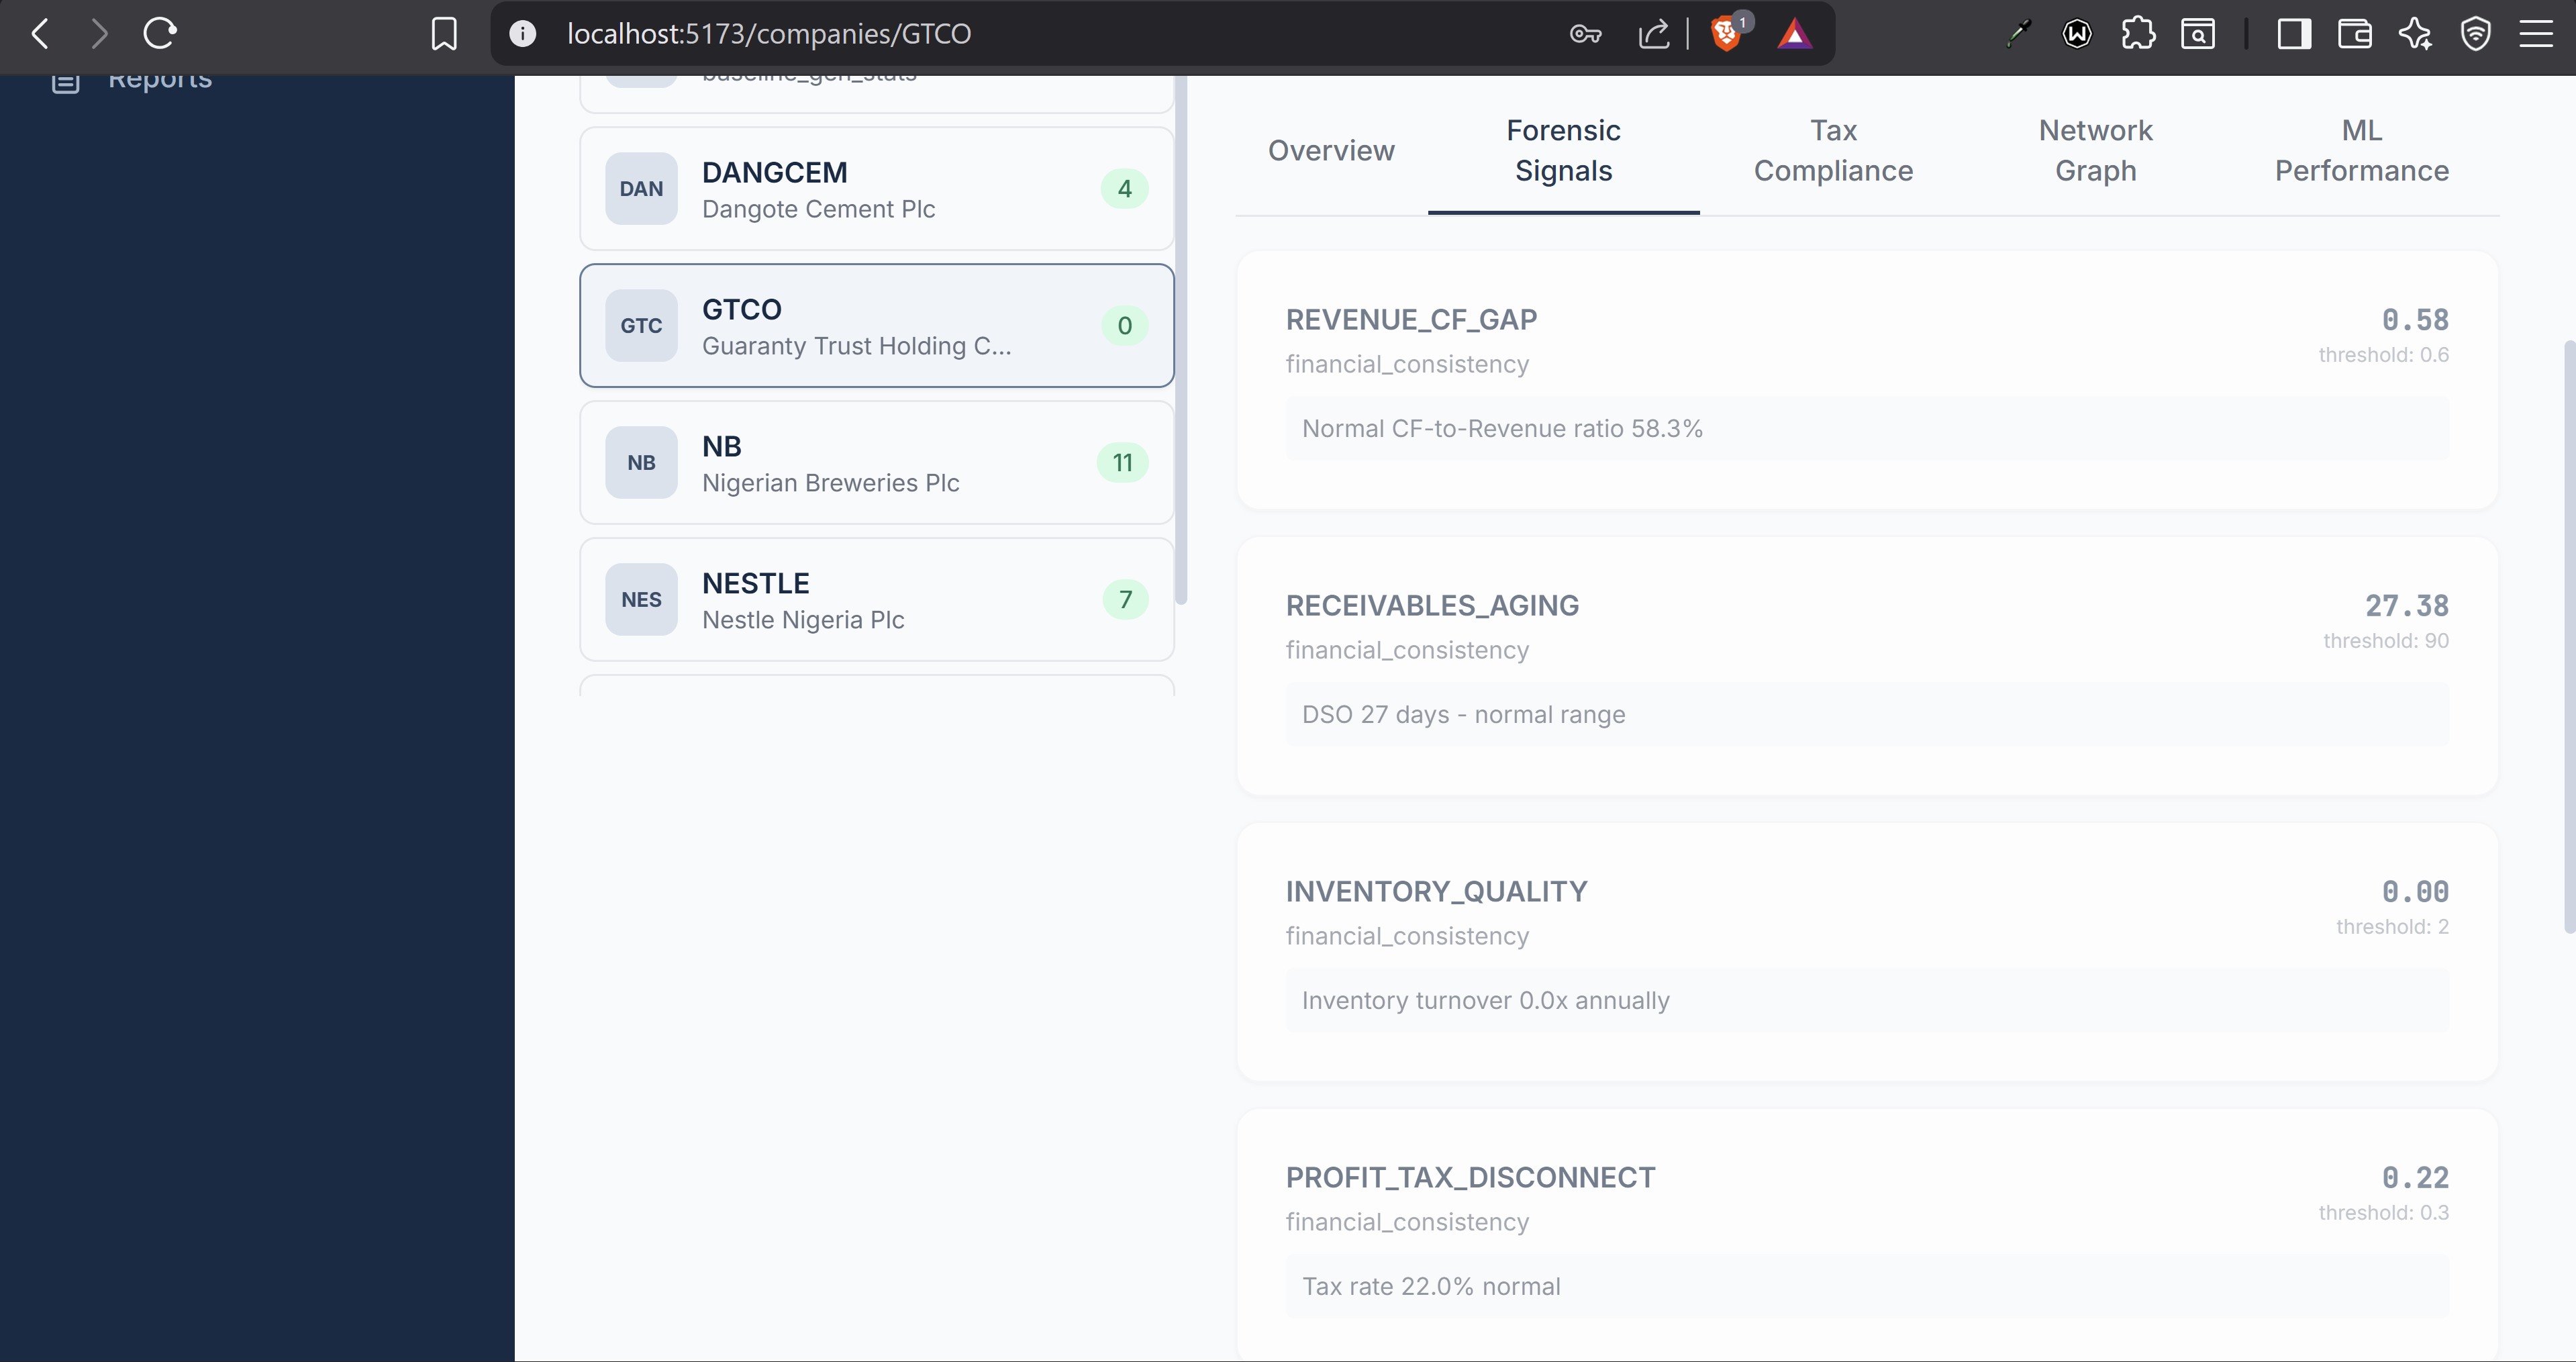
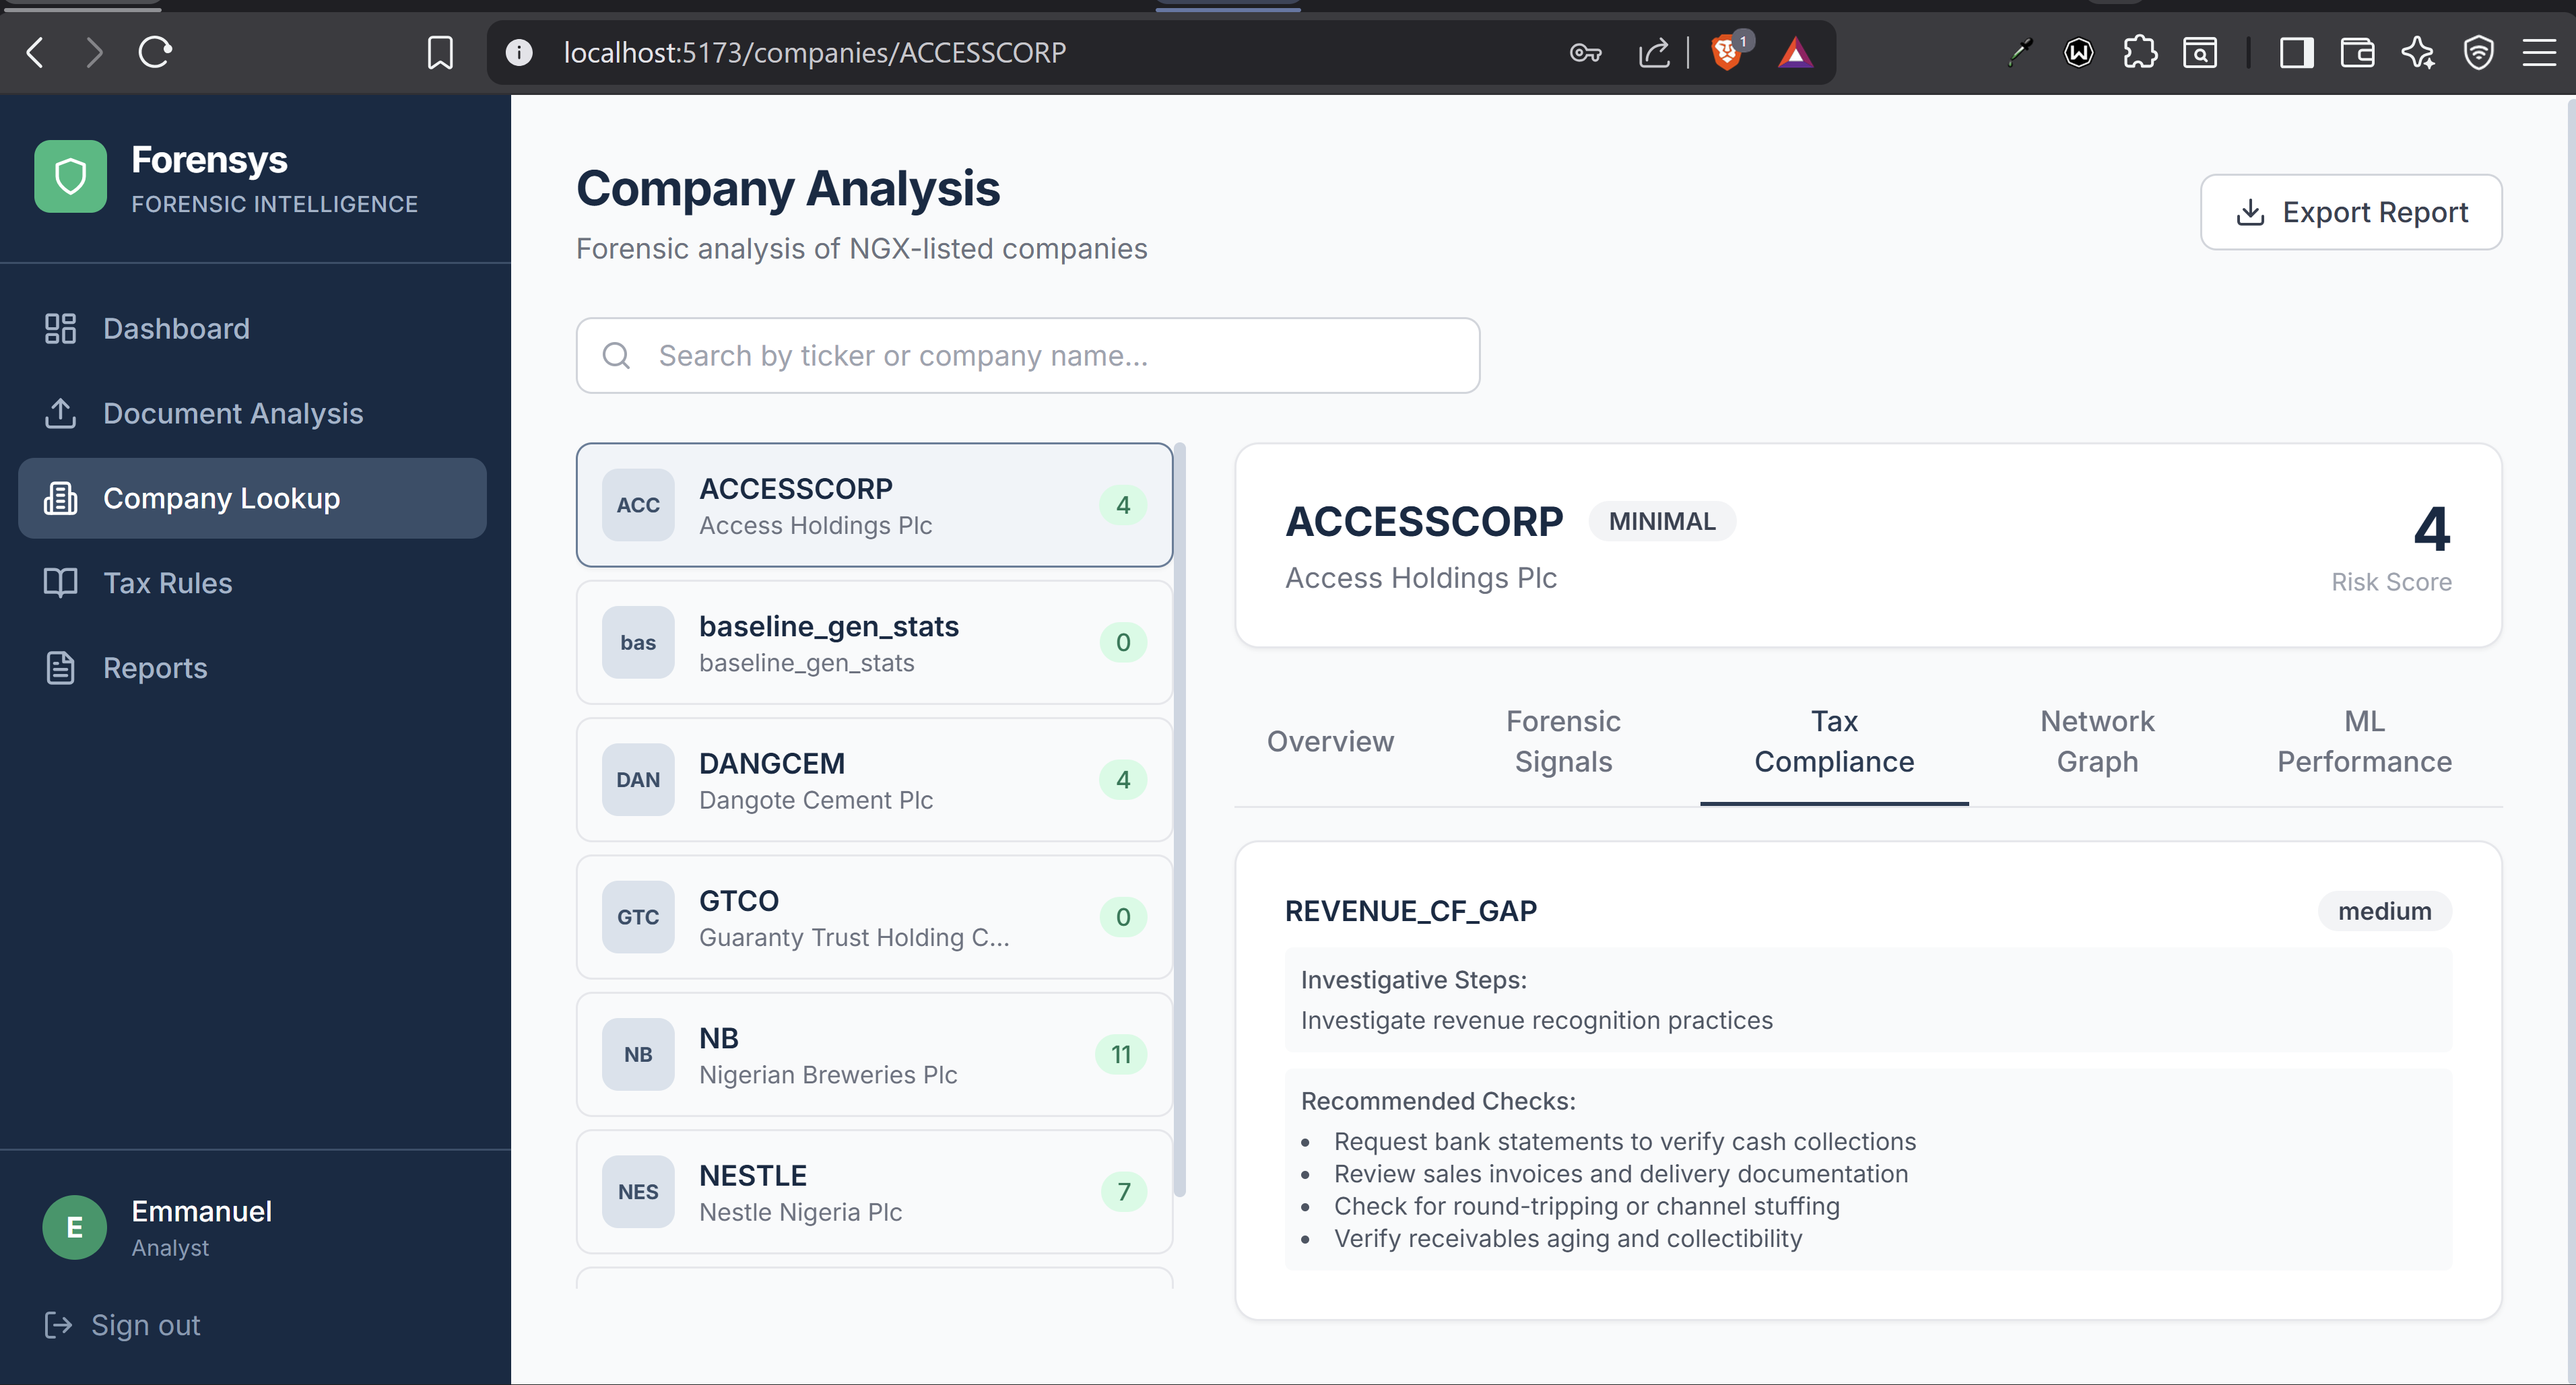
A Forensys workspace where an analyst selects a listed company and reviews a risk score with drill-downs: overview, forensic signals, tax compliance, network graph and ML performance.
Interpretable signals — not black-box scores alone. Each card shows the metric, the threshold, a plain-language note (e.g. DSO in normal range) and recommended investigative steps.
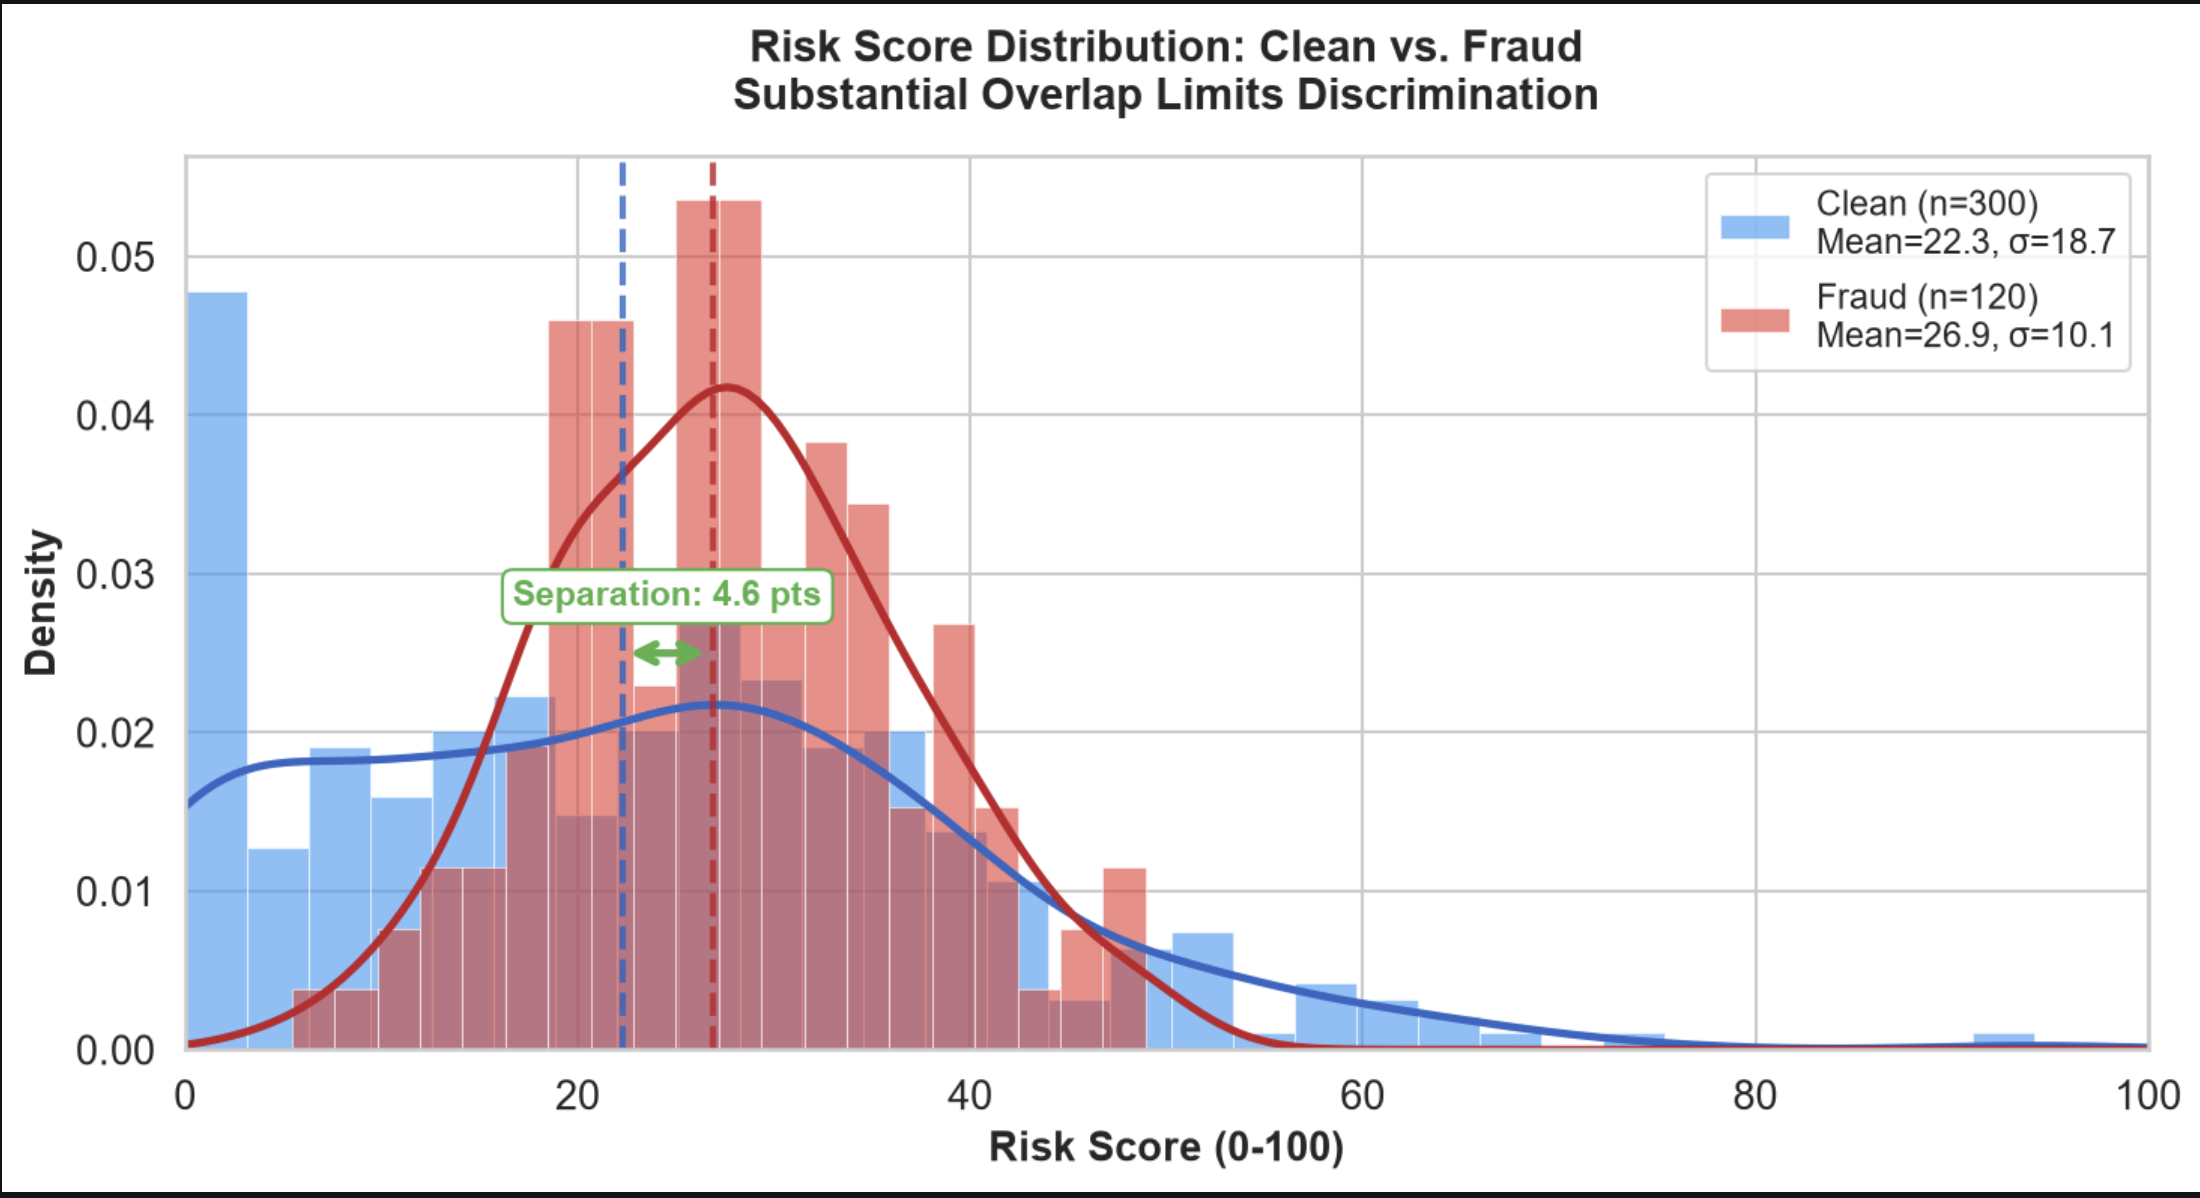
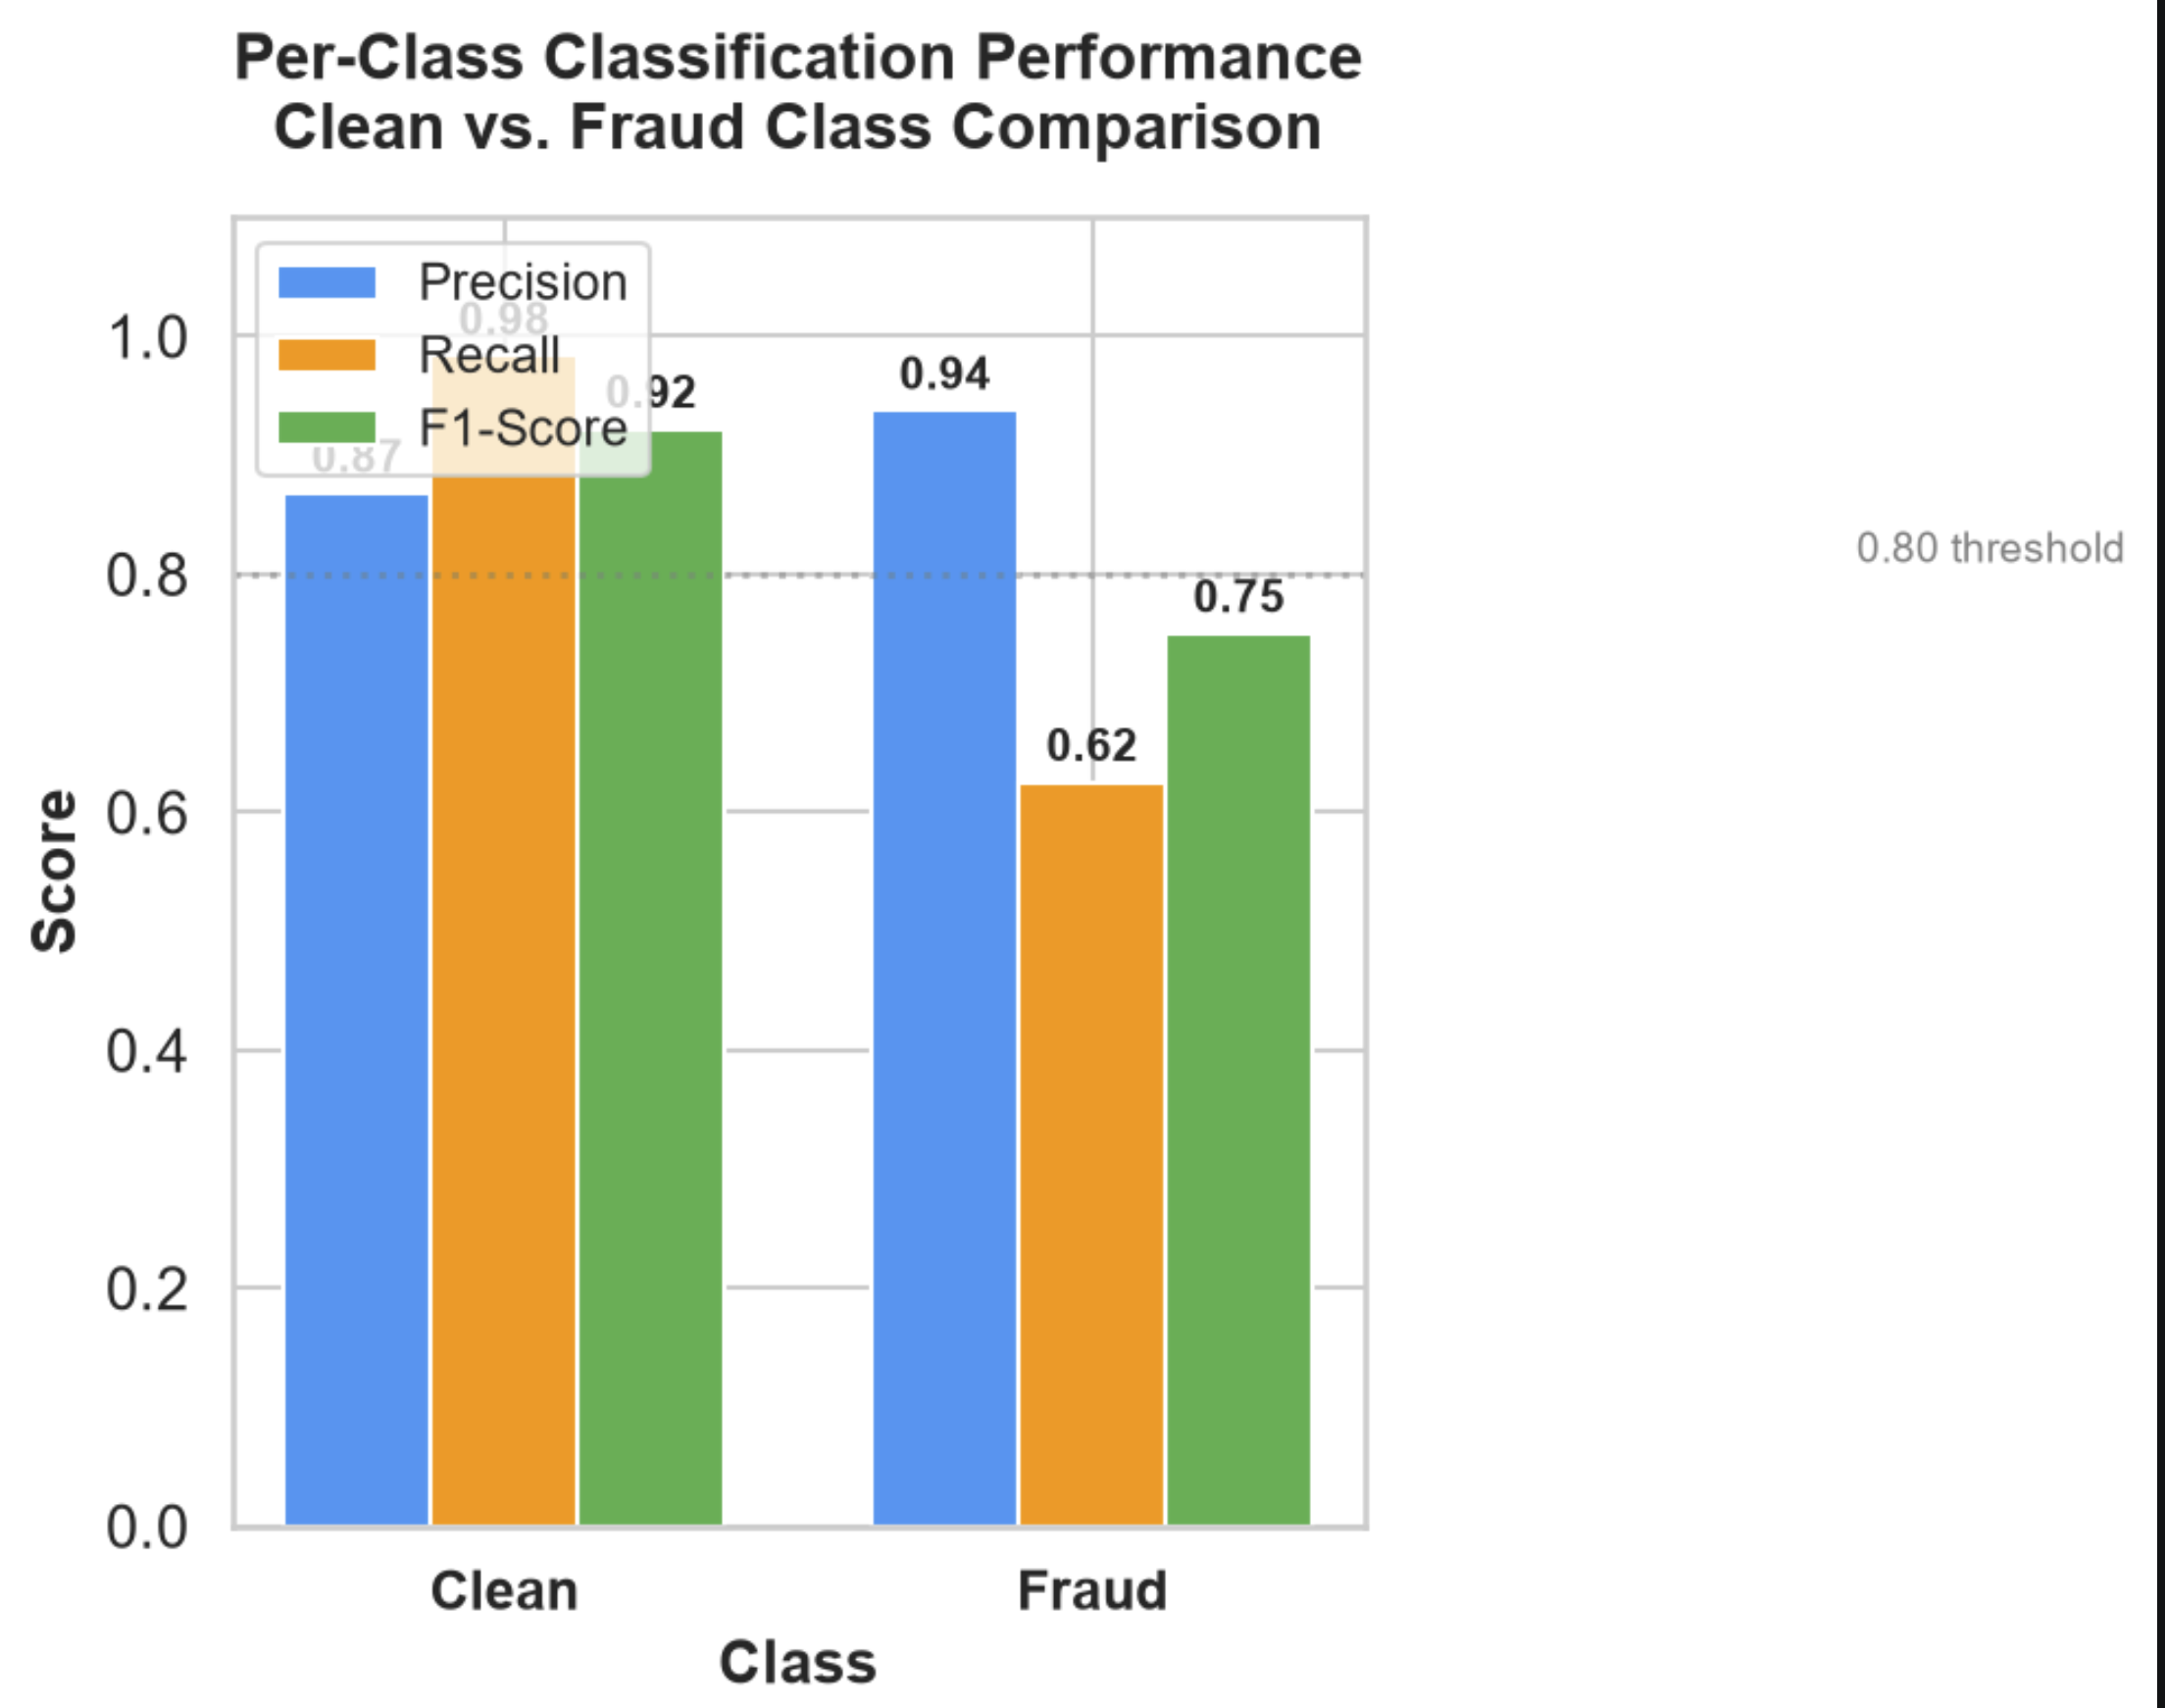
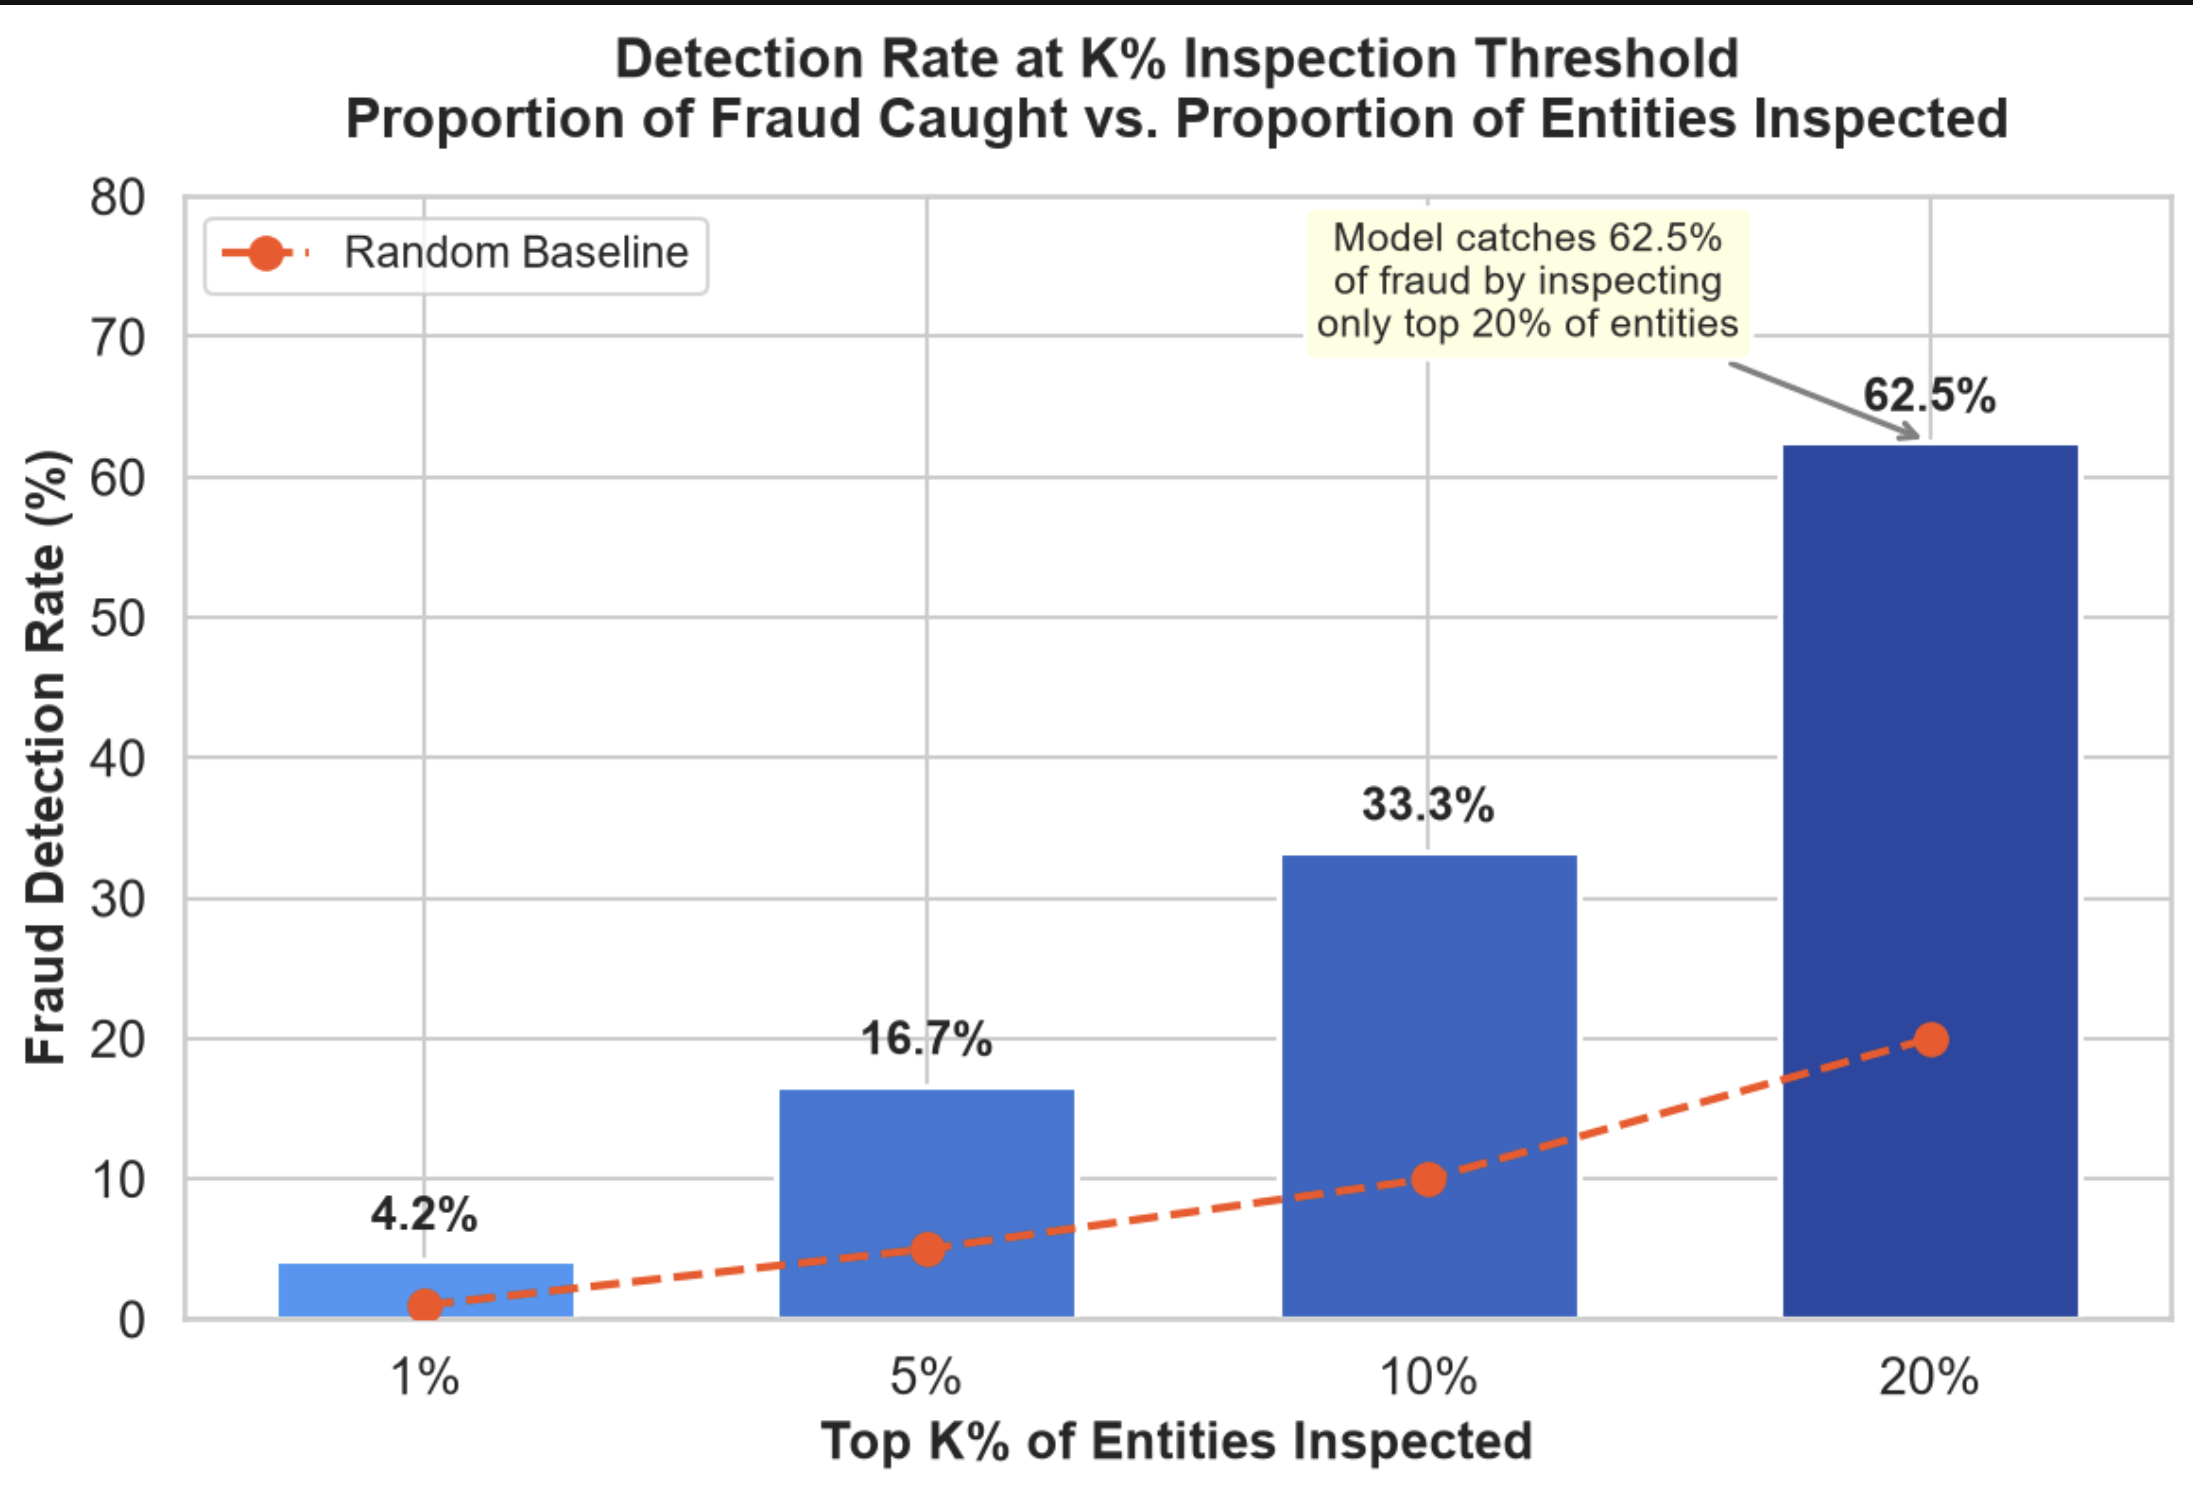
Model evaluation made visible inside the product: score distributions for clean vs. fraud cohorts and per-class metrics, so users understand discrimination limits instead of trusting a single number.
Exportable reports so findings can move from the tool into human review workflows.
05
06
07
Feature engineering focuses on interpretable financial ratios and relationships rather than opaque embeddings — every signal must be explainable to an auditor.
A rules-plus-model hybrid: deterministic threshold checks produce explainable flags; a learned score ranks severity and surfaces non-obvious combinations.
Evaluation embraces the hard truth of rare-event detection. On the current eval set (clean n=300, fraud n=120), score distributions overlap substantially — mean separation of 4.6 points — which is reported openly rather than hidden behind accuracy claims.
Per-class metrics (e.g. fraud-class recall 0.62 and F1 0.75 at a 0.80 threshold on the current split) drive iteration priorities: recall on the minority class matters more than overall accuracy here.
The interface is an analyst tool, not a dashboard demo: company context, signal detail, investigative steps and export are the core loop.
08 / Hard parts
Confirmed fraud is rare, delayed and selected. Building evaluation you can defend with limited positive labels — and being honest about what the metrics mean — was harder than training the model.
A risk score nobody can explain is unusable in compliance work. Every signal was designed to carry its own evidence: metric, threshold, plain-language note and suggested checks.
Clean and fraud score distributions overlap heavily on current data. Rather than overclaim, the system surfaces separation analysis so users calibrate trust — a 4.6-point mean separation informs how the score should be used as a triage tool, not a verdict.
The work needed to stay honest as research while still producing a usable interface. That meant separating evaluation views from decision views and labelling the system's limits inside the product itself.
09
A working research prototype: interpretable forensic signals over public financial data, risk scoring with visible evaluation, and an analyst interface covering company lookup, signal drill-down and reporting. Evaluation on the current holdout (clean n=300 / fraud n=120) shows meaningful but limited discrimination — mean score separation 4.6 points, fraud-class F1 0.75 at threshold 0.80 — reported as a triage aid under active research, not a production compliance guarantee.
Clean (n=300) vs fraud (n=120)
At 0.80 threshold, current split
Priority metric for rare events
Each with threshold + interpretation
10
Evidence
Research
Evaluation charts and methodology
Demo
Interface screenshots
Case study
Signal definitions and architecture
Private
Full codebase and data pipelines held internally
Technology
11
.png)
AI-powered fire risk prediction and computer vision detection.
Enterprise document intelligence with retrieval-augmented generation.
Spatiotemporal drought forecasting from climate, satellite and soil-moisture data.
Start a project
If this kind of system is close to your problem, tell us what you are trying to ship.